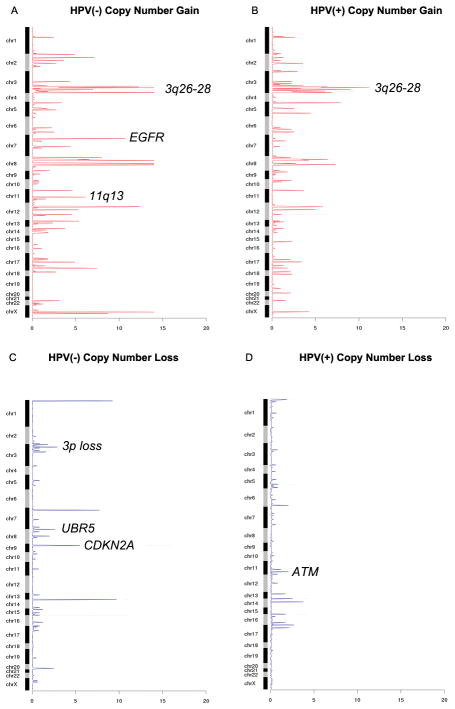
Figure 2. GISTIC-like copy number analysis derived from next generation sequencing data.
Shown are the aberrant regions of the chromosome and the respective negative log2 of the q-value of the alteration in each panel, respectively. (A) Copy number gains in HPV(−) samples. (B) Copy number gains in HPV(+) samples. (C) Copy number losses in HPV(−) samples. (D) Copy number losses in HPV(+) samples.

