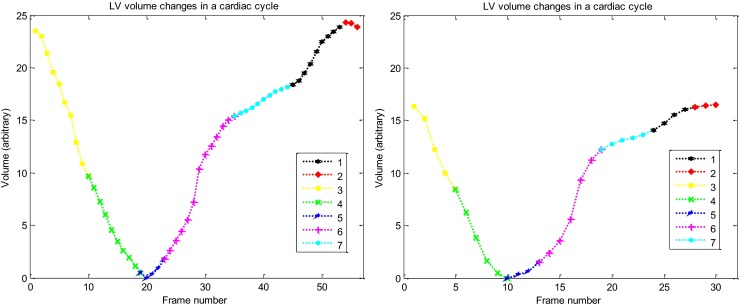
Fig. 6.

The curves of the LV volume changes measured by the proposed method in one complete cardiac cycle in two cases. Left healthy case and right patient case. (First phase: black, second: red, third: yellow, forth: green, fifth: blue, sixth: magenta, seventh: cyan)
