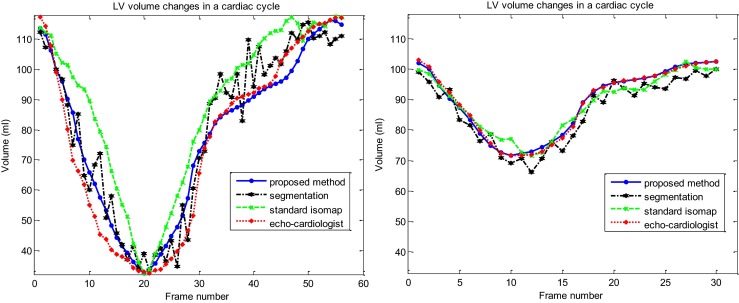
Fig. 7.

Comparison between the curves of LV volume changes measured by proposed method (solid line), standard Isomap method (dashed line), the image segmentation method (dash-dot line) and those obtained by the highly experienced echo cardiologist (dotted line) in one complete cardiac cycle in two cases. Left healthy case and right patient case
