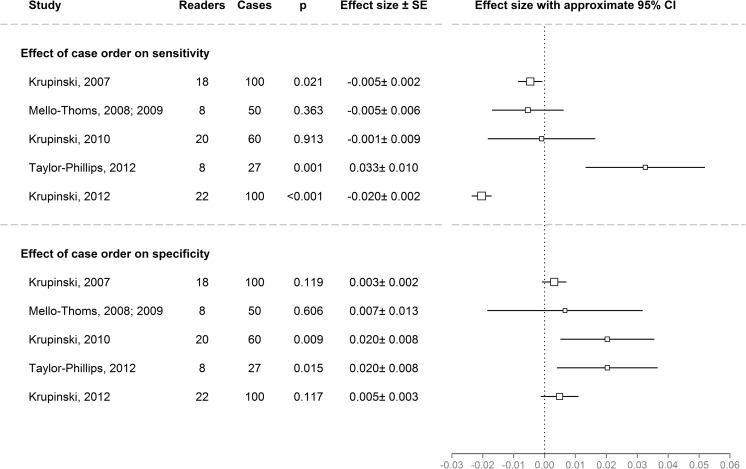
Fig. 3.
Overview of the effects of case order on sensitivity (top) and specificity (bottom) cases in the five datasets. Effect sizes were calculated using logit mixed effects models and exp(effect size) is the multiplicative change in the probability of being correct when moving from case i to case i + 1. Positive effects (greater than zero) indicate sensitivity/specificity increasing with time on task. Negative effects (less than zero) indicate sensitivity/specificity decreasing with time on task. The black box indicates the estimate for the effect size. The area of the black box is proportional to the standard error. The lines around the black box show 1.96 × standard error. p values are based on Wald Z-tests. Note that the effects of experience were not considered for this comparison, but the effect for the group of easier cases was considered for the Krupinski 2010 dataset

