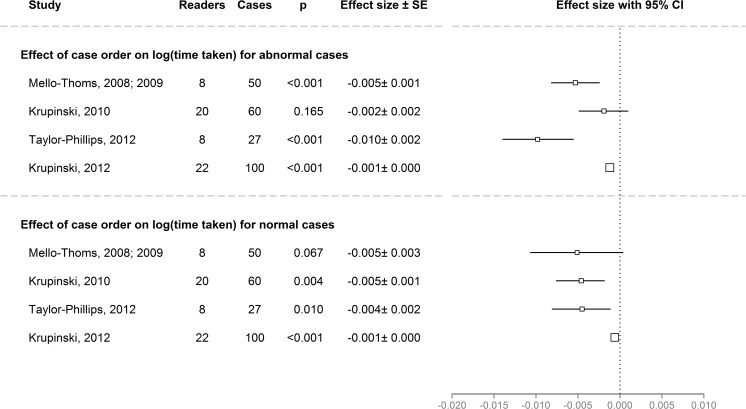
Fig. 4.
Overview of the effects of case order on time taken for cases classified as abnormal (top) and normal (bottom) in the five datasets. Effect sizes were calculated using linear mixed effects models and exp(effect size) is the multiplicative change in the log(time taken) when moving from case i to case i + 1. The decrease in time taken per case as the session progressed was significant in all studies. The black box indicates the estimate for the effect size. The area of the black box is proportional to the standard error. The lines around the black box show 95 % MCMC confidence intervals. p values are also based on MCMC. One study (Krupinski 2007) [15] did not have records of time taken per case so could not be included in this analysis

