
Figure 5.
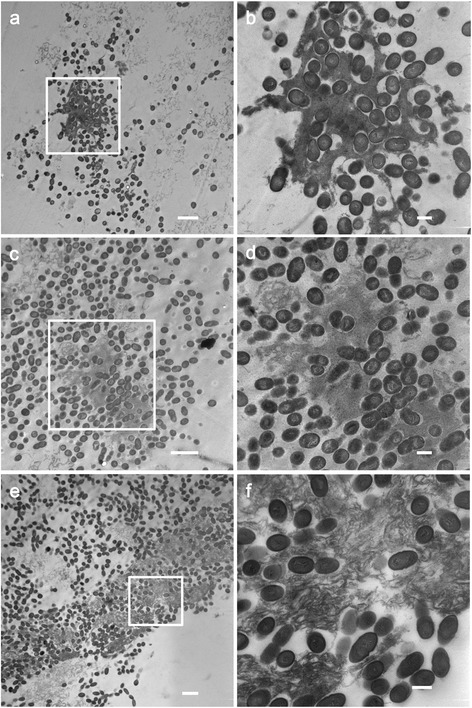
TEM images of IL-treated S. mutans biofilms. (a), (b) control. Biofilms treated with (c), (d) 10% [Ch][Lac] and (e), (f) 10% [C2mim][AcO]. The EPS appears as electron-dense materials around the bacterial cell. (a), (c), (e) Low-magnification images, scale bars = 2 μm. (b), (d), (f) High-magnification images, scale bars = 500 nm.