
Figure 6.
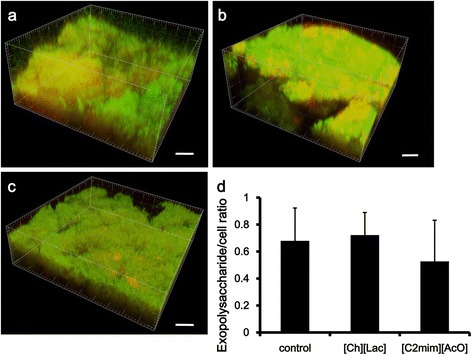
CLSM observation of S. mutans biofilms treated with ILs. Three-dimensional images of (a) control, (b) 10% [Ch][Lac]-treated and (c) 10% [C2mim][AcO]-treated biofilms. Scale bars = 10 μm. Exopolysaccharide is shown in red and bacterial cells in green. (d) Levels of exopolysaccharide represented by the ratio of the fluorescence of the exopolysaccharide to that of the cells. There was no significant difference between corresponding experimental and control groups (P > 0.01). Data are presented as the mean ± standard error (n = 8).