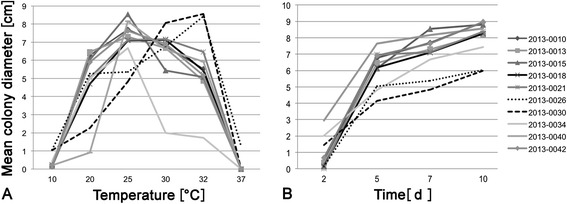
Figure 2.

Mean colony diameter of isolated F. pinicola strains on MEA (n = 3 per strain). A. After 7 days of incubation at different temperatures. B. Mean growth kinetics at 25°C. ANOVA result at 25°C (optimal growth temperature) p = 0.000125. Strains with significant differences after post hoc test: 20130026-20130010 (p = 0.028); 20130026-20130015 (p = 0.002); 20130026-20130040 (p = 0.006); 20130026-20130042 (p = 0.04); 20130030-20130010 (p = 0.004); 20130030-20130013 (p = 0.018); 20130030-20130015 (p = 0.0002); 20130030-20130018 (p = 0.04); 20130030-20130021 (p = 0.03); 20130030-20130040 (p = 0.0008); 20130030-20130042 (p = 0.006).
