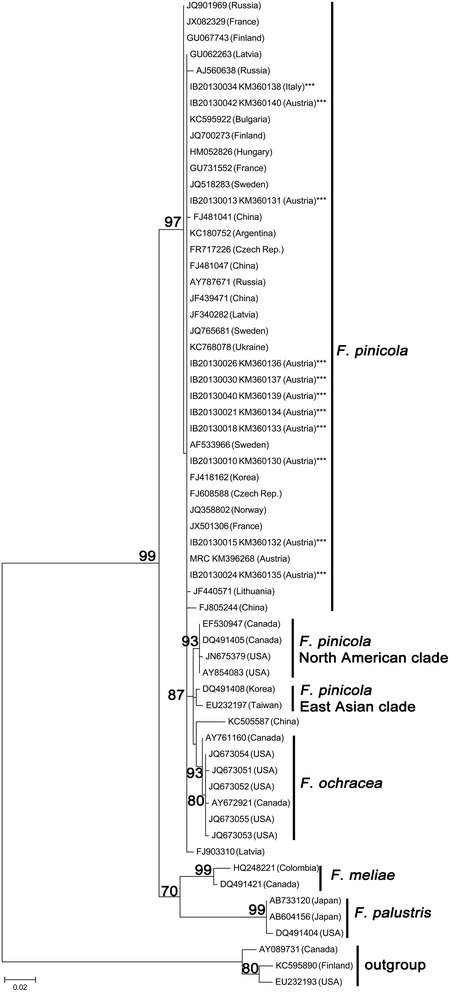
Figure 5.

Phylogenetic placement of F. pinicola strains inferred by using the Maximum Likelihood method based on the Hasegawa-Kishino-Yano model. The tree with the highest log likelihood (-1629.3947) is shown. Initial tree(s) for the heuristic search were obtained by applying the Neighbor-Joining method to a matrix of pairwise distances estimated using the Maximum Composite Likelihood (MCL) approach. A discrete Gamma distribution was used to model evolutionary rate differences among sites (5 categories (+G, parameter = 0.3750)). The tree is drawn to scale, with branch lengths measured in the number of substitutions per site. The analysis involved 61 nucleotide sequences. All positions with less than 95% site coverage were eliminated. There were a total of 504 positions in the final dataset. Bootstrap values above 75 % are given (1 000 replications). Evolutionary analyses were conducted in MEGA6.
