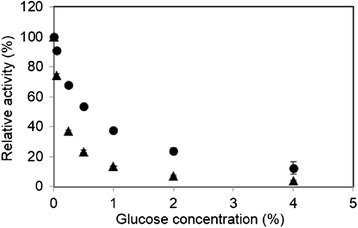
Figure 5.

Comparison of the sensitivity of inhibition by glucose between rAaBGL1 (closed circle) and AnBGL (closed triangle). Each enzymes were incubated with 1.5 mM pNP-Glc in the presence of 0, 0.05, 0.25, 0.5, 1.0, 2.0, and 4.0% glucose. Released p-nitrophenol was measured from the absorbance at 405 nm. Data are expressed at the mean ± the standard deviation of three independent experiments.
