Figure 6.

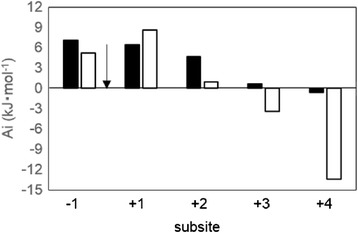
Subsite affinity map of rAaBGL1 for cellooligosaccharides (black bar) and laminarioligosaccharides (white bar), calculated using the K m and the k cat values. Arrow indicated the cleavage site.

Subsite affinity map of rAaBGL1 for cellooligosaccharides (black bar) and laminarioligosaccharides (white bar), calculated using the K m and the k cat values. Arrow indicated the cleavage site.