
Fig. 5.
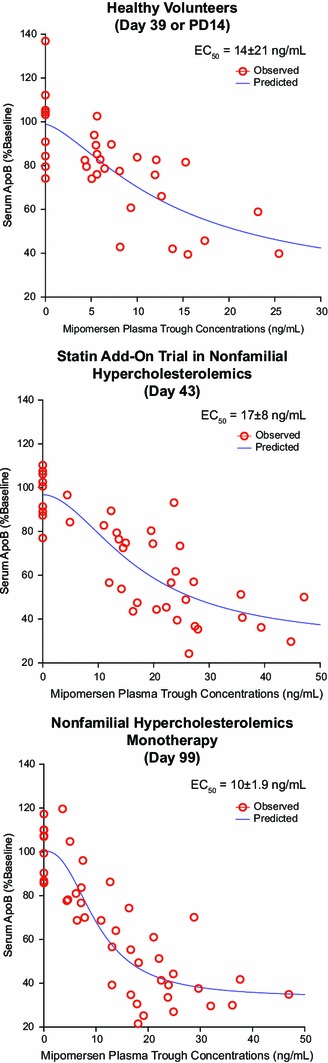
Plasma concentration-response relationships for mipomersen. The individual points represent measurements of apoB or mipomersen in serum of (a) healthy volunteers or (b) phase II studies in hypercholesterolemic patients in combination with statins or (c) as a single agent. Reproduced from Crooke et al. [26], with permission. apoB apolipoprotein B, PD14 14 days after the last dose