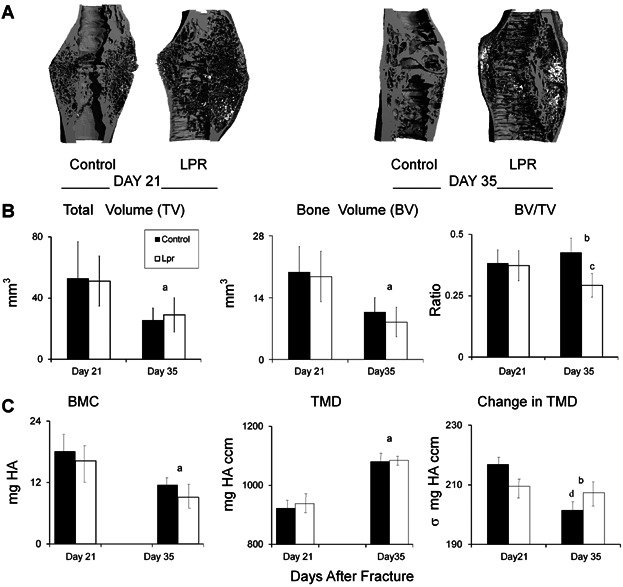
Figure 1.

Callus microstructure at 21 and 35 days after fracture as assessed by micro-CT. (A) Representative renderings on days 21 and 35 days after fracture. The reconstructed images were cut longitudinally to show the internal microstructure. (B) Graphical analysis of the structural micro-CT measurements of fracture calluses at 21 and 35 days after fracture. (C) Graphs showing characteristics of differences based on mineral content. The error bar is ± SD. a = significance by time; b = significant interaction by time and strain; c = difference by strain at a single time point; d = difference by time for a single strain. Significance was at p < 0.05.
