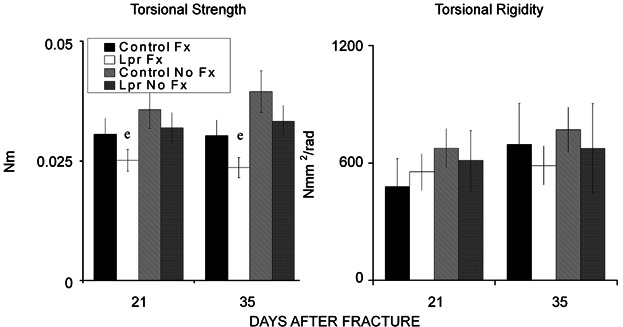
Figure 2.

Results of the torsion tests. (Left panel) Comparison of torsional strength (in Nm) of the calluses from control and B6.MRL-Faslpr/J mice at 21 and 35 days after fracture and of contralateral femora from the two genotypes at matching time points. (Right panel) Comparison of torsional rigidity (in Nmm2/rad) among these same groups. e = significance by strain. The error bar is ± SD. Significance was at p < 0.05.
