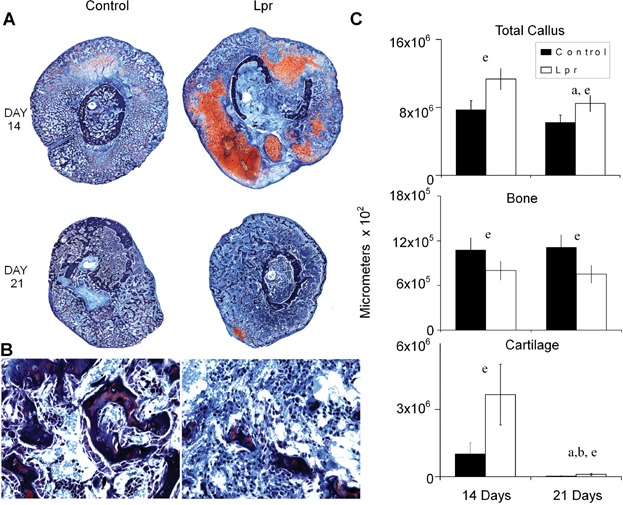
Figure 3.

Histological analysis of fracture calluses at days 14 and 21 days after fracture (safranin-O and fast green). (A) Representative micrographs from 14 and 21 days after fracture. (Top panel) Composite images of fracture calluses (×100 magnification). (B) Representative micrographs of trabecular and medullary tissues at 21 days after fracture (×200 magnification). (C) Graphic analysis showing the total callus area, total cartilage area, and total bone areas in µm2 as calculated from the histomorphometric analysis for the control and B6.MRL-Faslpr/J strains at days 14 and 21 days after fracture. The mean value from 5 representative sections per callus (a total of 5 calluses were used per time point) are shown. The error bar is ± SD. Group differences are as denoted in Fig. 1. Statistical comparisons between strains times and interactions are as denoted by letters and are as presented in Figure legends 1 and 2. Significance was at p < 0.05.
