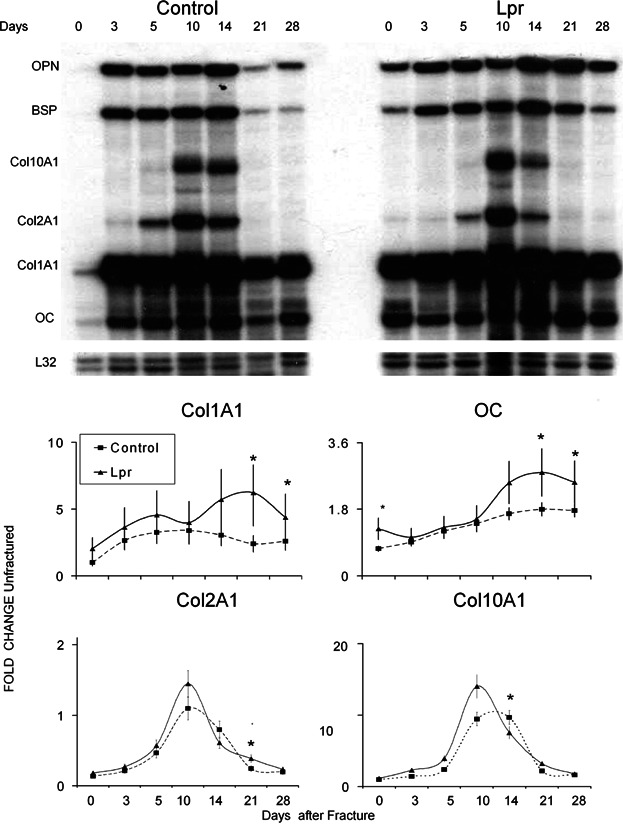
Figure 4.

Analysis of expression of bone- and cartilage-specific mRNAs. (A) Representative autoradiographic image of the RPA products as resolved on a 6% denaturing sequencing gel. Matrix genes are depicted. Days after fracture, mouse strain, and positions of each protected gene are denoted in the figure. L32 (mouse ribosomal protein) was used as an internal standard. (B) Graphic analysis of the relative mRNA expression levels of four of the mRNAs indicative of either cartilage or bone tissue development obtained from RPA analysis over the time course of fracture healing. The nature of each of the mRNAs that is presented is indicated in the legend of the figure. Data presented are mean values from n = 4 gels, and error bars are + SD. *Significance between the two strains at p < 0.05.
