Figure 7.

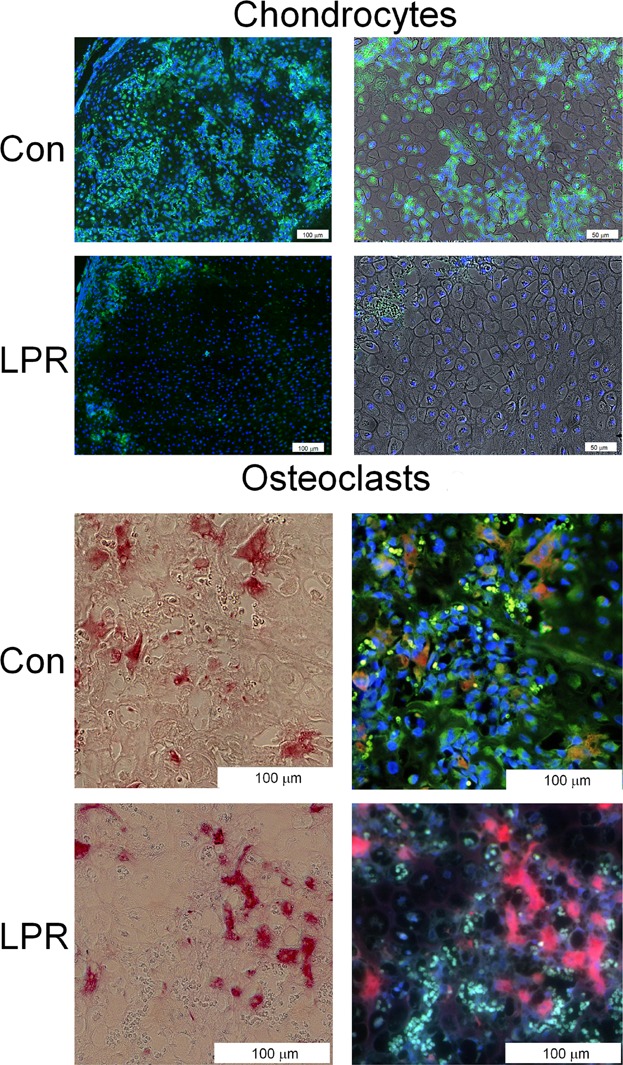
Immunohistological analyses of chondrocyte and osteoclasts within 14-day callus tissues that show caspase 3 reactivity. Under fluorescent excitation, caspase antibody staining is bright green and red blood cells are autofluorescent and appear as small bright green cells, whereas backgrounds appear as defuse light green. DAPI staining is bright blue and stains the nuclei of cells. Under fluorescent excitation, TRAP staining is red and double-stained cells with caspase stain orange. Under light field, TRAP cells appear as pink-red cells. (Upper panels) Sequential set of micrographs showing fluorescent images of chondrocytes that are reactive with anti-caspase 3 antibody in control (CON) and Lpr strain of mice (LPR). A low-magnification fluorescent image and higher-magnification image from the same field superimposing the fluorescent on light level photomicrograph are presented. Cells were co-reacted with DAPI to identify the nuclei of the individual cells in the micrographs. (Lower panels) Sequential set of micrographs showing light level and fluorescent images of TRAP-positive osteoclasts. Those cells that are reactive with anti-caspase 3 antibody are stained orange, and borders of these cells show a green edge. Cells were co-stained with DAPI to identify the individual cells in the micrographs. Magnification is indicated in each image.
