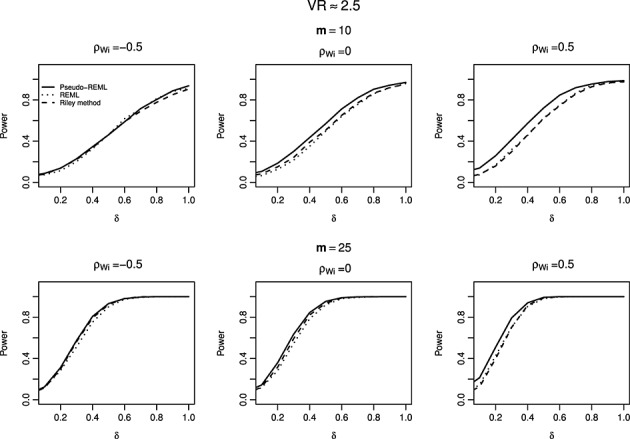
Figure 2.

The power curves of restricted maximum likelihood (REML) method, Riley method, and Pseudo-REML method, with the within-study/between-study variation ratio close to 1, for different number of studies m and within-study correlations ρWi. The between-study correlation ρB is 0.5. The number of simulations is 5000.
