Fig 3.

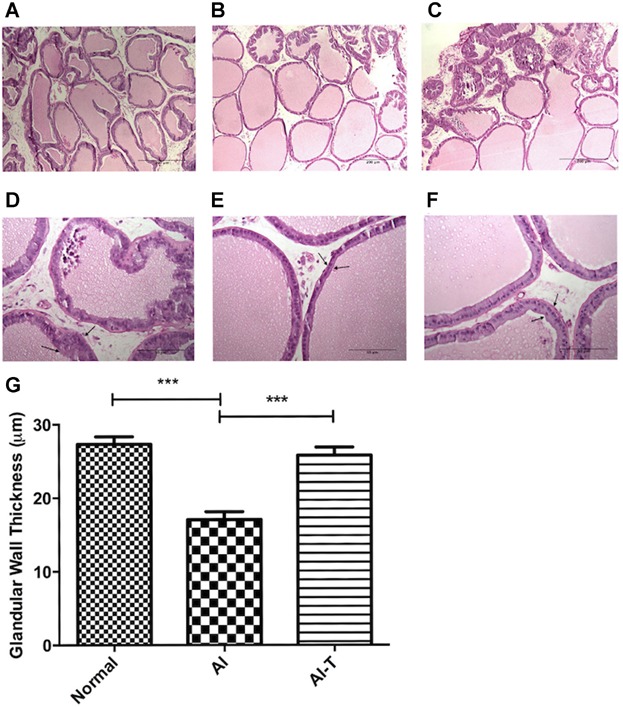
Average glandular wall thickness was assessed by H&E staining of the ventral prostate (upper panel: 100× (original magnification), scale bar represents 200 µm, lower panel: 400× (original magnification), scale bar represents 50 µm) in control (panels A,D), AI (panels B, E) and AI-tadalafil (panels C, F) groups. Arrow represents glandular wall. In panel G the average glandular wall thickness is quantified in the control (Normal) (n = 8), AI (n = 11), and AI-tadalafil (n = 8) groups. ***P < 0.001.
