
Fig 4.
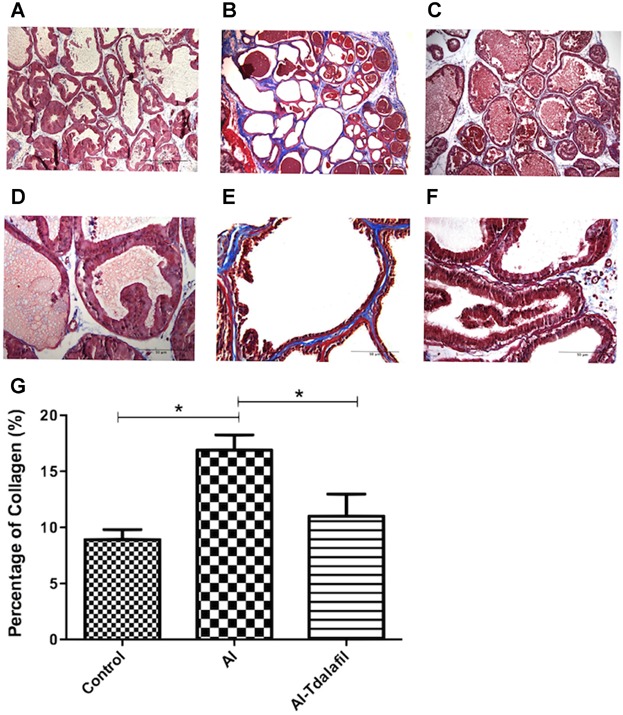
Demonstration and quantification of the amounts of collagen (blue) and stroma (red) in the rat ventral prostate using Masson's Trichrome staining in animal of the control (A, D), AI (B, E), and AI-tadalafil (C, F) groups (upper panel: 100× (original magnification), scale bar represents 200 µm, lower panel: 400× (original magnification), scale bar represents 50 µm). Panel G shows percentage of collagen in ventral prostate glands (*P < 0.05).