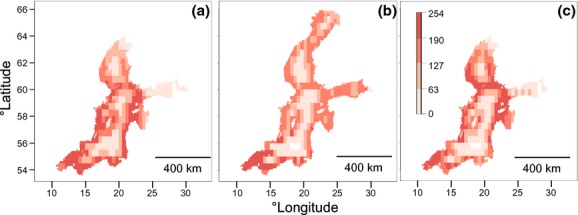
Figure 3.

The potential distribution (PD) for Idotea balthica in the Baltic Sea using the following layers: (a) sea-surface temperature (SST), sea ice concentration (SIC), maximum depth (MD) and distance to land (DL) (AUC: 0.90, omission error: 1.34%), (b) sea-surface salinity (SSS), MD, DL (AUC: 0.91, omission error: 1.13%), and (c) SST, SIC, SSS, MD and DL (AUC: 0.90, omission error: 1.32%). The colour scale indicates habitat suitability, ranging from 0 (unsuitable, in white) to 254 (maximum suitability, in dark red).
