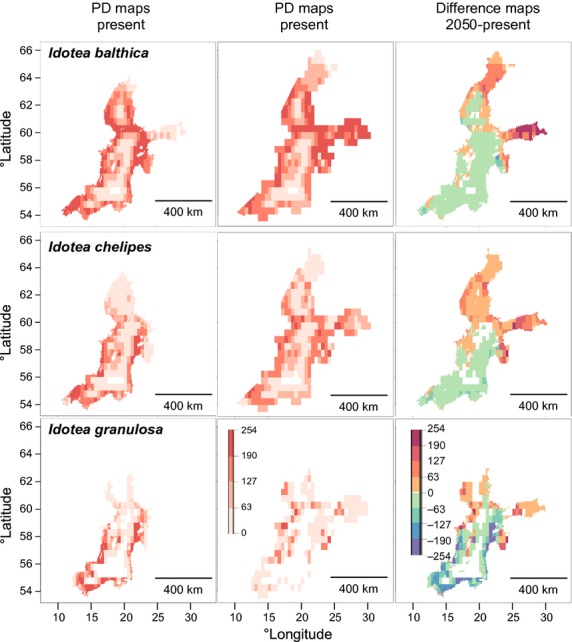
Figure 4.

Maps showing the potential distribution for Idotea balthica,I. chelipes and I. granulosa in the Baltic Sea. The colour scale in the potential distribution (PD) maps indicates habitat suitability, ranging from 0 (unsuitable, in white) to 254 (maximum suitability, in dark red). On the difference maps (2050–present) colours from green to red indicate an increase in habitat suitability and those from green to blue indicate a decrease.
