
Figure 4.
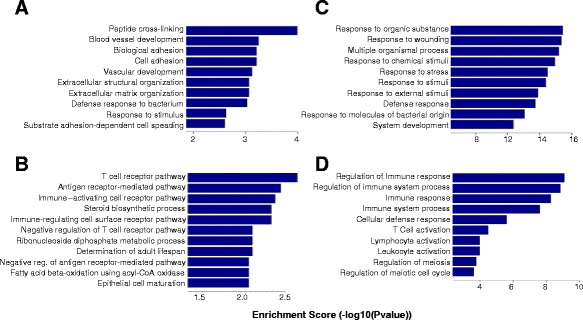
Gene expression profile comparisons regarding the biological process. Graphs describe co–differentially upregulated genes (A) and downregulated genes (B) in the biological process of peripheral blood mononuclear cells from patients with chronic obstructive pulmonary disease (COPD), including those with stable COPD and acute exacerbation of COPD (AECOPD), as compared to healthy control subjects. Also shown are co–differentially expressed upregulated genes (C) and downregulated genes (D) from patients with AECOPD, as compared to patients with stable COPD and healthy control subjects.