
Figure 5.
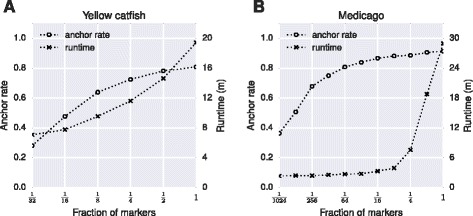
Effect of marker density on the performance of ALLMAPS based on resampling of real data. The scaffold anchor rates and program running times were assessed based on the sub-samples of increasing sizes for (A) yellow catfish and (B) Medicago datasets.