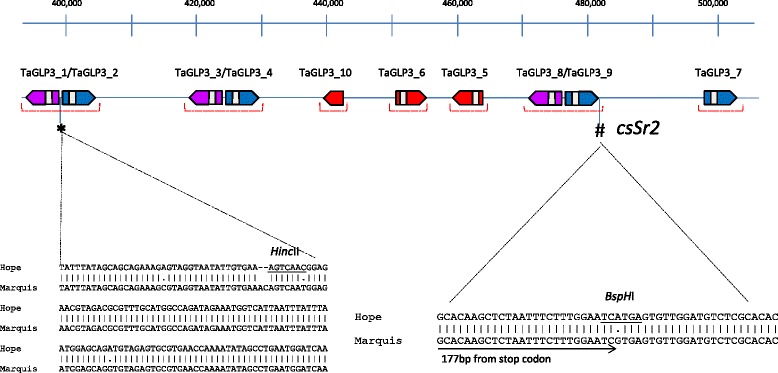
Figure 3.

Organization of TaGLP3 genes at the CS (Hope3B) Sr2 locus. GLPs belonging to same group are shown in the same color (blue or purple). The pseudo genes are shown in red. The red bracket underneath the GLPs indicates the region PCR amplified from Marquis and sequenced. The asterisk (*) shows the position of the SNPs/ indels between Hope and Marquis between TaGLP3_1/2 and the hash symbol (#) shows the position of CAPs marker csSr2 [27]. The sequence comparison between Hope and Marquis showing the respective SNPs/indels is shown at the bottom.
