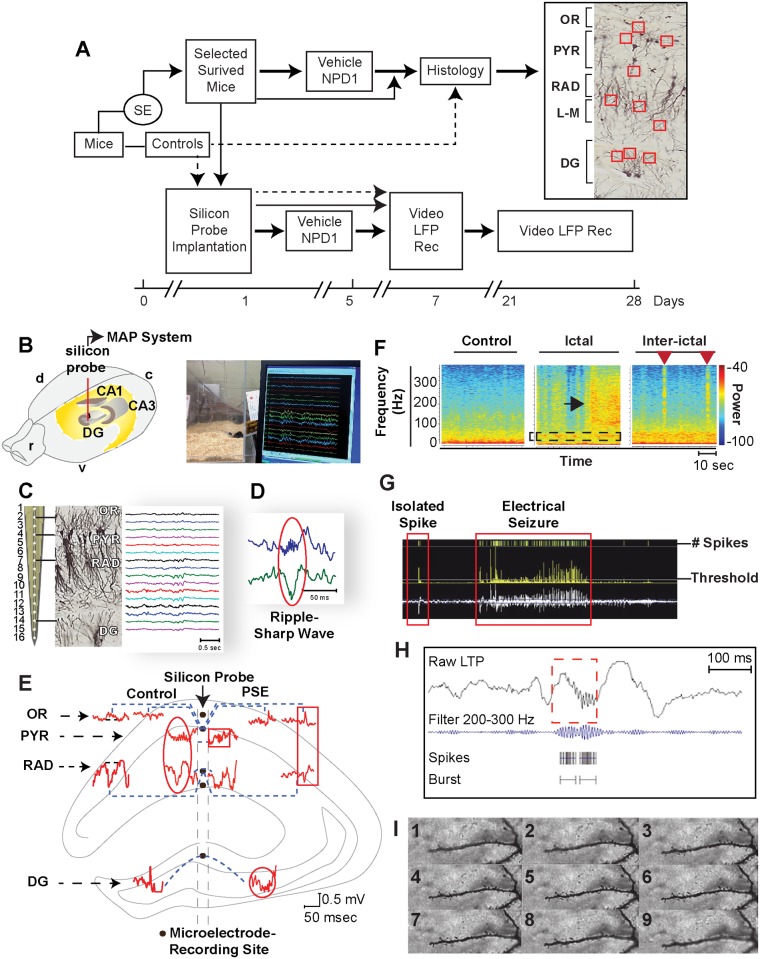
Figure 1. Experimental design to evaluate hippocampal aberrant neuronal networks in an epileptogenesis-induced post-status epilepticus model in mice.
A: Algorithm depicting experimental design. Dashed line: control mice; thin line: mice in epileptogenesis non-treatment group; bold line: mice in epileptogenesis or epilepsy groups treated with NPD1 or vehicle. Right: Area of interest for dendritic spine analysis in hippocampal layers (Stratum oriens, SO; Stratum Lacunosum-Moleculare, L-M; and the DG). B: Silicon probe (red line) implanted in dorsal hippocampus. r: rostral; v: ventral; c: caudal; d: dorsal. Below: Representative simultaneous behavior and local field potential (LFP) recordings in freely-moving mice. LFPs were recorded from a silicon probe implanted in the dorsal CA1-dentate gyrus (DG) axis using Multiple Acquisition Processor (MAP) data acquisition system (Plexon). C: Silicon probe with 16 channels in the dorsal hippocampus, showing projections from CA1 pyramidal and granular cells from the DG using Golgi staining and hippocampal layers: stratum oriens (OR), pyramidal layer (PYR), stratum radiatum (RAD), and DG and representative LFPs (right traces). D: Representative ripple-sharp wave complex (circle) from CA1. E: Spontaneous LFP patterns from dorsal hippocampal regions (graphic in the background) of adult mice recorded from silicon probe before (control) and 14 days after SE (PSE) induced by pilocarpine administration. Control: Positive wave in OR associated with negative sharp wave in RAD, dentate spikes in DG, and ripples associated with sharp wave (oval). In PSE: fast ripple (square box); high frequency oscillation (HFO) in DG (circle) associated with positive spike in OR and interictal spikes with opposite phase in CA1 (rectangle). F: Seizures show a high frequency component (black arrow) preceded by an increase in gamma band (box), a reduced theta band. Interictal epileptiform activity with high frequency component (red arrows). G: Screenshot of automatic detection and quantification of spikes from seizures and a burst of HFO (H) using Offline Sorter V3 (Plexon). Rec: recording. I: Representative pictures (1–9) of one dendrite captured using the 100x/oil high magnification objective using Z-stack method of imaging (233–260 frames for each dendrites) at 0.3 μm between each consecutive image.

