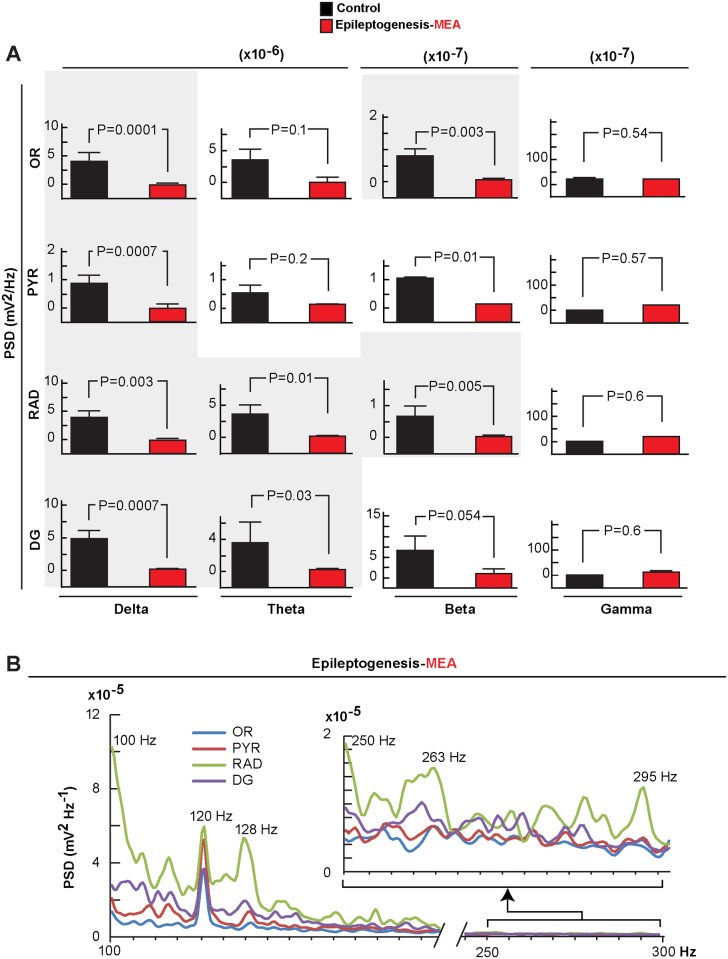
Figure 4. Frequency analysis of microepileptiform activity in epileptogenesis.
Frequency bands (delta, theta, beta and gamma) show reduced microepileptiform activity (MEA), except for theta and gamma, in all hippocampal layers, and reduced beta activity in the stratum oriens (OR) and dentate gyrus (DG) compared with controls. Bars indicate means and error bars represent S.E.M. P = p value (two sample t-test). B: Average of values of the frequency power of the signal of MEA (n = 7) showing peaks above 120 Hz synchronized in all hippocampal layers. Stratum radiatum, RAD; pyramidal layer, PYR; power spectral density, PSD.

