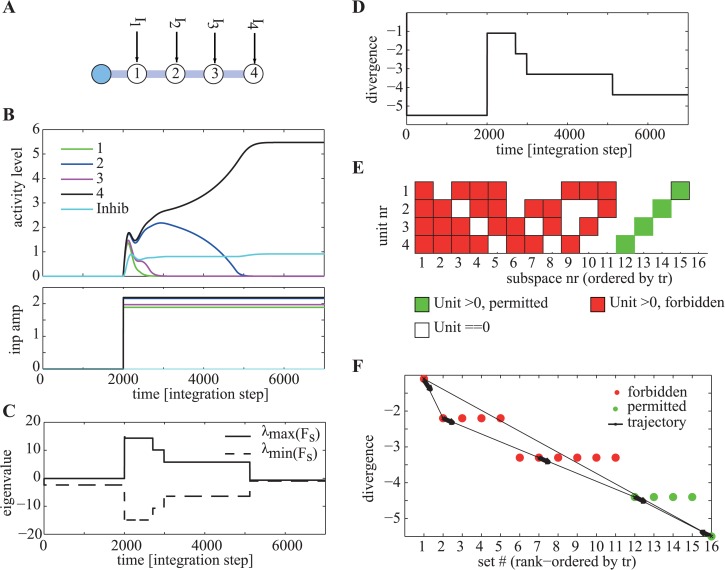
Figure 2. Illustration of key concepts to describe biological computation.
(A) Connectivity of the circuit used in this figure. (B–F) Simulation results, with parameters α1 = 1.2, β 1 = 3, β 2 = 0.25, G 5 = 1.5, G 1..4 = 1.1. (B) Activity levels (top) as a function of time for the units shown in (A) and external inputs provided (bottom). After stimulus onset at t = 2000, the network selectively amplifies the unit with the maximal input while suppressing all others. (C) Maximal and minimal eigenvalue of the functional connectivity F S active at every point of time. At t = 5000 the system enters a permitted subspace, as indicated by the max eigenvalue becoming negative. (D) Divergence as a function of time. The divergence decreases with every subsapce transition. (E) Illustration of all possible subspaces (sets) of the network. Subspaces are ordered by their divergence. For these parameters, only subspaces with at most one unit above threshold are permitted (green) whereas the others are forbidden (red). (F) Divergence as a function of subspace number (red and green circles) as well as trajectory through set space for the simulation illustrated in (B–D). Note how the divergence decreases with each transition, except when the input changes (set 16 is the off state).

