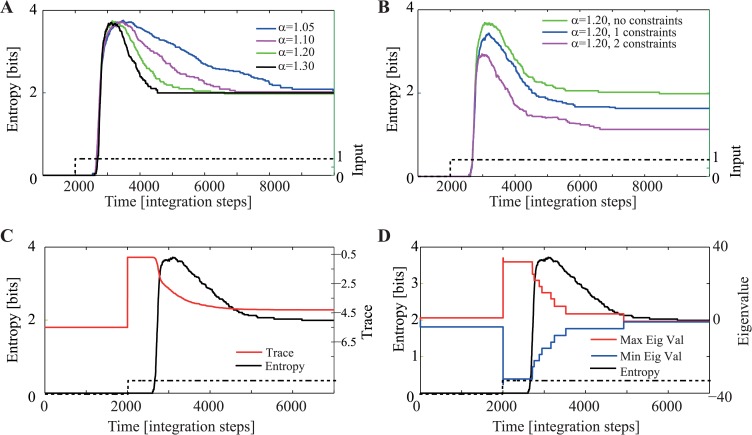
Figure 3. Spontaneous increase followed by reduction of state entropy during the expansion phase.
Random inputs were provided to the 5-node network as shown in Fig. 2. Each input Ii was chosen i.i.d from a normal distribution with μ = 6 and σ = 0.25. (A) Entropy as a function of time and gain of the network. Higher gains are associated with faster increases and reductions of entropy but converge to the same asymptotic entropy. This indicates that each permitted subspace is reached with equal probability. (B) Adding constraints reduces the peak and asymptotic entropy. The more constraints that are added, the larger is the reduction in entropy. (C) Comparison of time-course of average entropy and divergence (trace). (D) Comparison of time-course of average entropy and eigenvalues (min, max). Notice how both the divergence (C) and the eigenvalues (D) reach their maximal values well before the entropy reaches its maximum.

