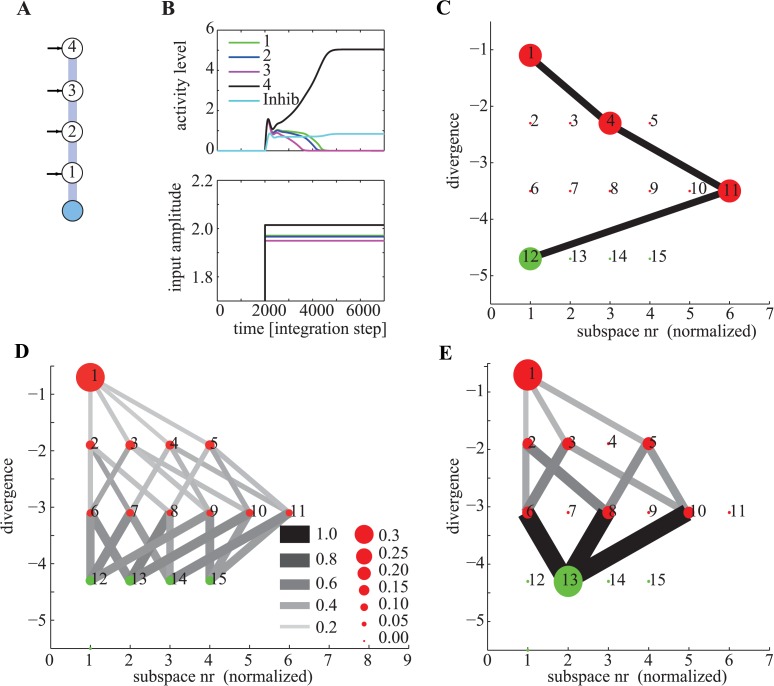
Figure 4. Hierarchy of subspaces and steering of computation.
(A) 5-node network, using notation from Fig. 2. (B) Simulation of an individual run. Top shows the state and bottom the inputs to the network. The unit with the maximal input wins (unit 4). (C) Trajectory through state space for the simulation shown in (B). Each subspace is numbered and plotted as a function of its divergence. Red and green dots indicate forbidden and permitted subspaces respectively. Numbers inside the dots are the subspace (set) numbers (see Fig. 2E). (C–D) Transition probabilities for the same network, simulated with 1000 different random inputs. Connected subspaces are subsets between which the network can transition, in the direction that reduces divergence (gray lines). The size of dots and lines indicates the likelihood that a subset will be visited or a transition executed, respectively. The subset with most negative divergence is the zero set (all units off), which is not shown. (C) All transitions made by the network. Depending on the value of the input, the network will reach one of the permitted subspaces. Notice the strict hierarchy: all transitions were towards subspaces with lower divergence and only a subset of all possible transitions are possible. (D) All transitions the network made, conditional on that subspace 13 was the solution. Note that this subspace cannot be reached from some subspaces (such as nr 7).

