
Figure 2. Syndecan-3 knock down reduce the cell surface levels of TFPI.
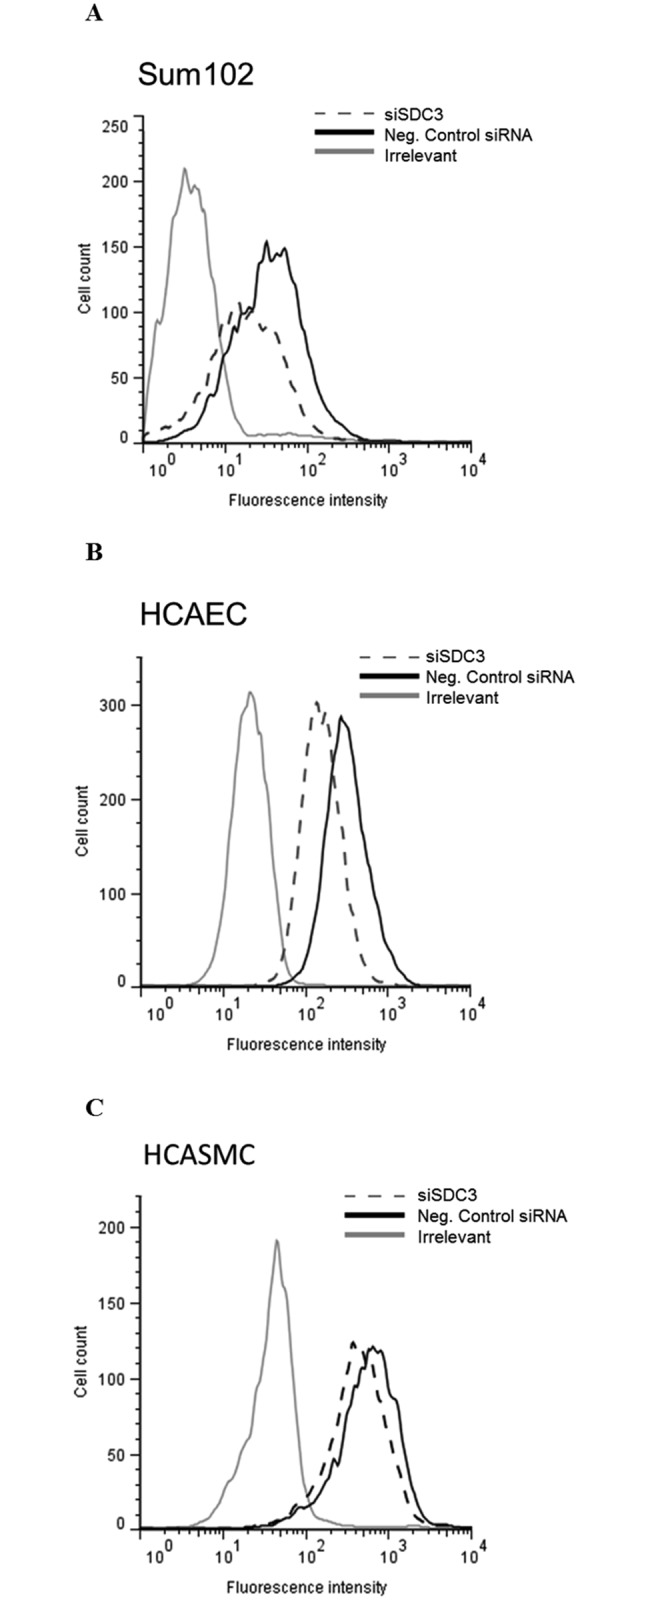
Cells knocked down for syndecan-3 by siRNA technology were analyzed for levels of cell surface TFPI by flow cytometry. The histogram presents median fluorescence intensity obtained after TFPI specific antibody labelling in A) Sum102 cells, B) HCAEC cells and C) HCASMC cells. Syndecan-3 knocked down cells (siSDC3); dashed line, negative control siRNA; black solid line and irrelevant control; grey solid line. One representative experiment of three individual experiments (n≥6 biological parallels) is shown for each cell type.