
Figure 3. Syndecan-3 antigen levels in syndecan-3 knocked down cells.
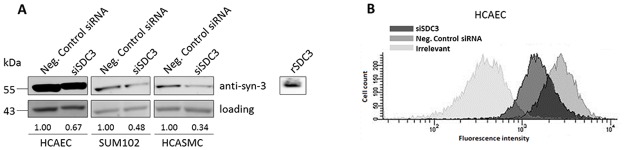
A) Syndecan-3 antigen levels (the 55 kDa monomeric form) in cell lysates from HCAECs Sum102 cells, and HCASMCs by Western blotting using anti-syndecan-3 and loading control (actin). One representative membrane of two is shown. Syndecan-3 protein band intensities (after normalization against loading control) relative to control cells are indicated for each cell type. Recombinant syndecan-3 (rSDC3) served as a positive control (~110 kDa). B) Cell surface associated syndecan-3 levels analyzed by flow cytometry in HCAEC cells. The histogram presents median fluorescence intensity obtained after syndecan-3 specific antibody labelling. Syndecan-3 knocked down cells (siSDC3); dark grey shaded, negative control siRNA; medium grey shaded and irrelevant control; light grey shaded. One representative experiment of two individual experiments (n = 4 biological parallels) is shown.