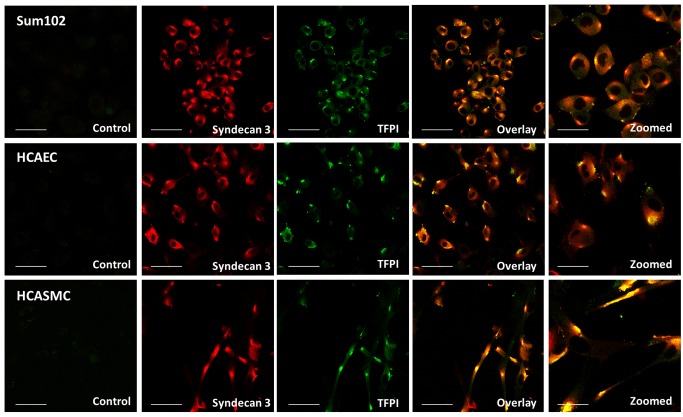
Figure 6. TFPI and syndecan-3 colocalize at the cell surface.
Fixed cells were double stained with TFPI (green) and syndecan-3 (red) primary antibodies and Alexa Fluor secondary antibodies with 488 and 633 nm excitation wavelengths, respectively, before images were captured using confocal microscopy. Yellow colour in the overlay images demonstrate spatial overlap between TFPI and syndecan-3. Sum102 cells (top), HCAEC cells (middle) and HCASMC cells (bottom). Scale bar 50 μM (30 μM for zoomed images). One representative experiment of three individual experiments is shown for each cell type.

