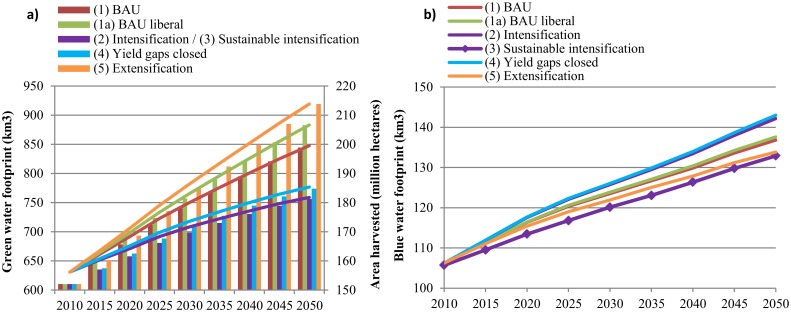
Fig 3. Green and Blue Water Footprints under different scenarios in Latin America and the Caribbean from 2010 to 2050.
(a): Evolution of the total Green Water Footprint (represented as the line chart on the left axis) and area harvested (represented as the bar chart on the right axis) of all crops in Latin America and the Caribbean from 2010 to 2050. (b): Evolution of the total Blue Water Footprint of all crops and livestock in Latin America and the Caribbean from 2010 to 2050. BAU refers to the Business-as-Usual scenario. Scenarios are described in Table 1. For green water, the intensification (2) and sustainable intensification (3) scenarios are presented together, because both scenarios have the same productivity assumptions and they only differ in terms of blue water use.

