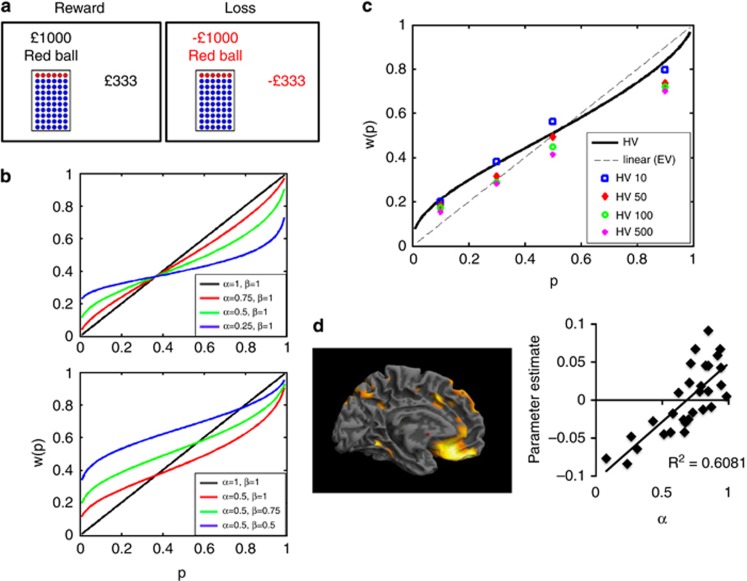
Figure 1.
(a) Risk task. Subjects chose between a gamble and sure choice in both reward and loss conditions across 4 probabilities (0.1, 0.3, 0.5, 0.9) and 4 expected values (£10, £50, £100, £500). A staircase procedure was used to estimate the gamble's certainty equivalents (amount of sure payoff in subject indifferent between sure payoff and gamble). (b) Examples of functions with different nonlinear (α) and convexity (β) values. (c) Probability weighting, w(p), data of healthy volunteers (HV) in reward condition as a function of objective probability, p. The dotted line represents certainty equivalence=expected value. (d) Regression analysis of gray matter volume and α. The regression represents left ventromedial prefrontal cortex as a function of α.

