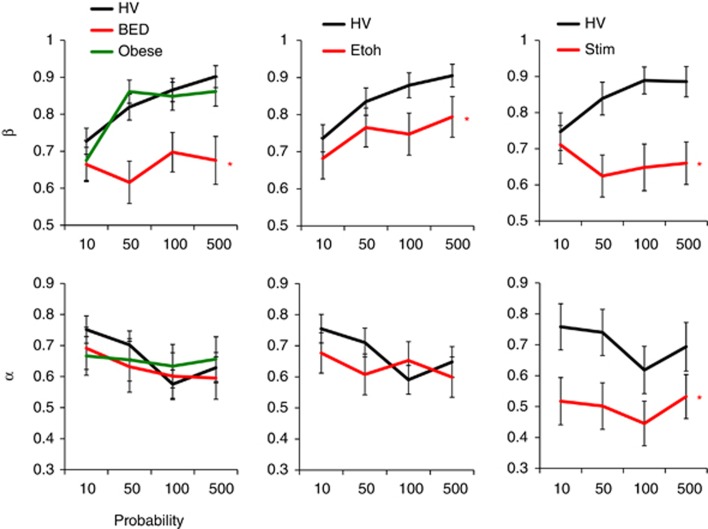
Figure 5.
Convexity (β) and nonlinearity (α). The graphs compare convexity (β; top) and nonlinearity (α; bottom) in obese subjects with binge eating disorder (BED) and without BED (obese controls), abstinent alcohol-dependent (EtOH) and abstinent methamphetamine-dependent (Meth) subjects vs their own age- and gender-matched controls. Error bars represent SEM. *Main Group effect. Details of significant differences are described in the text and Supplementary Table S5. HV, healthy volunteers; Stim, abstinent stimulant dependent.

