
Figure 3. PrfA* bypasses the requirement for glutathione during infection.
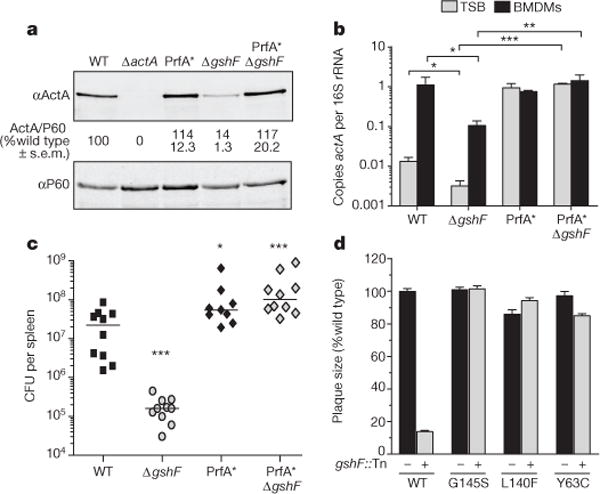
a, Representative immunoblot of infected BMDMs. Quantification is as described in Fig. 2. b, Quantitative reverse transcription polymerase chain reaction (RT–PCR) of actA transcript abundance. Mean ± s.e.m. for three independent experiments is shown. c, Mice were infected as described in Fig. 2. Data area combination of two independent experiments, n = 10 per strain. The median of each group is represented as a horizontal line. d, Plaque size. Mean ± s.e.m. for three independent experiments is shown. In all panels asterisks denote a significant difference compared to wild type, unless otherwise indicated, as determined by Student’s t-test; *P < 0.05, **P < 0.01, ***P<0.001.