
Extended Data Figure 3. The effect of ΔgshF is not specific to actA regulation.
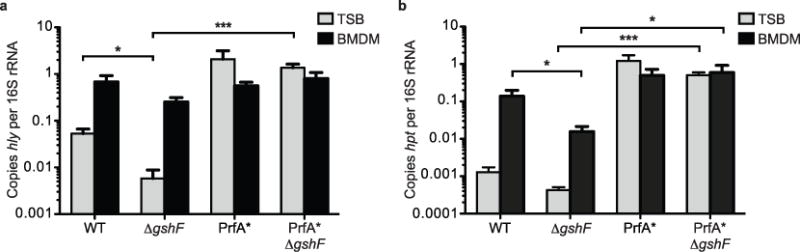
Quantitative RT–PCR of hly (a) or hpt (b) transcript levels. Bacteria were harvested from TSB at mid-log (grey bars) or 4 h post-infection of BMDMs (black bars). Mean ± s.e.m. of three independent experiments is shown. P values were calculated using Student’s t-test.*P < 0.05; ***P < 0.001.