
Figure 2. Listeria monocytogenes ΔgshF is attenuated in vivo.
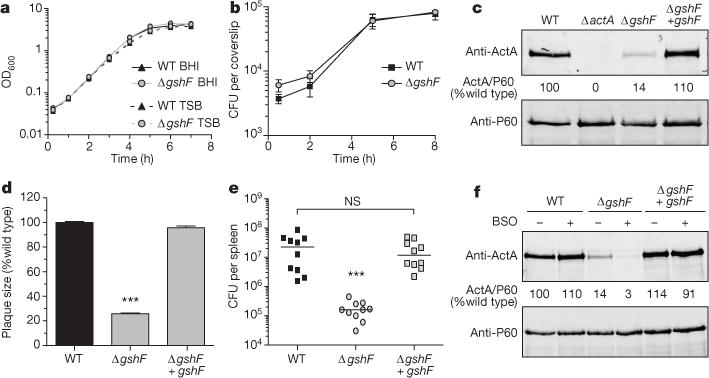
a, Broth growth curve in brain heart infusion (BHI) or tryptic soy broth (TSB). Data are representative of three independent experiments. b, BMDM growth curve. Mean ± standard error of the mean (s.e.m.) for three independent experiments is shown. c, Representative immunoblot of infected BMDMs. Numbers are the mean of four independent experiments and indicate ActA normalized to P60, as a per cent of wild type. d, Plaque size. Mean ± s.e.m. for three independent experiments is shown. e, CD-1 mice were infected intravenously and analysed as described in Methods. Data are a combination of two independent experiments, n = 10 mice per strain. The median of each group is represented as a horizontal line. f, Representative immunoblot of infected BMDMs. Quantification is as described in c. In all panels P values were calculated using Student’s t-test; ***P < 0.001; NS denotes P > 0.05.