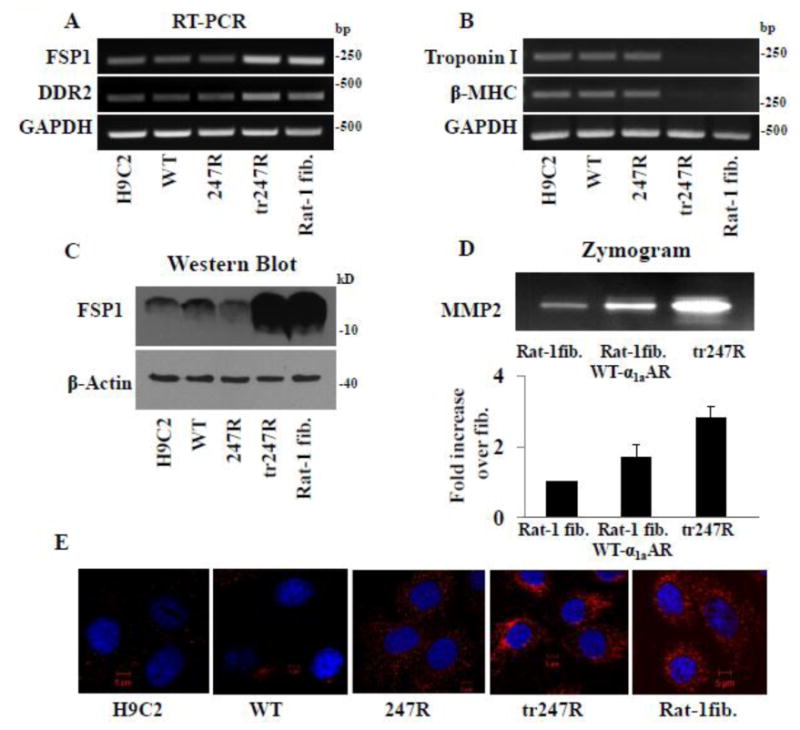
Figure 3.

Tr247R cells exhibit fibroblast-like phenotype and express fibroblast markers. (A) Expression of fibroblast markers is upregulated in tr247R cells while expression of cardiac markers (B) is downregulated as determined by RT-PCR using gene specific primers and GAPDH as internal control. (C) FSP1 protein levels in tr247R cells are comparable to those in Rat-1 fibroblasts (Rat-1 fib) as determined by Western blot analyses with FSP1 specific antibody; β-actin was used as a loading control. Western blot with longer exposure time (30min) for FSP1 protein is shown to demonstrate expression levels in cells with myoblast morphology. (D) MMP2 levels are elevated in tr247R cells compared with fibroblasts as determined by zymograms. Representative image is presented. Lower panel depicts relative band intensities, values are presented as mean±SE, n=4. (E) Vimentin levels in tr247R cells are comparable to that in Rat-1 fibroblasts as determined by immunocytochemistry using vimentin antibody (red) and DAPI for nuclear staining (blue). Rat-1 fibroblasts or Rat-1 fibroblasts expressing WT-α1aAR were used to confirm fibroblast-like phenotype. Representative images are presented, n=3.
