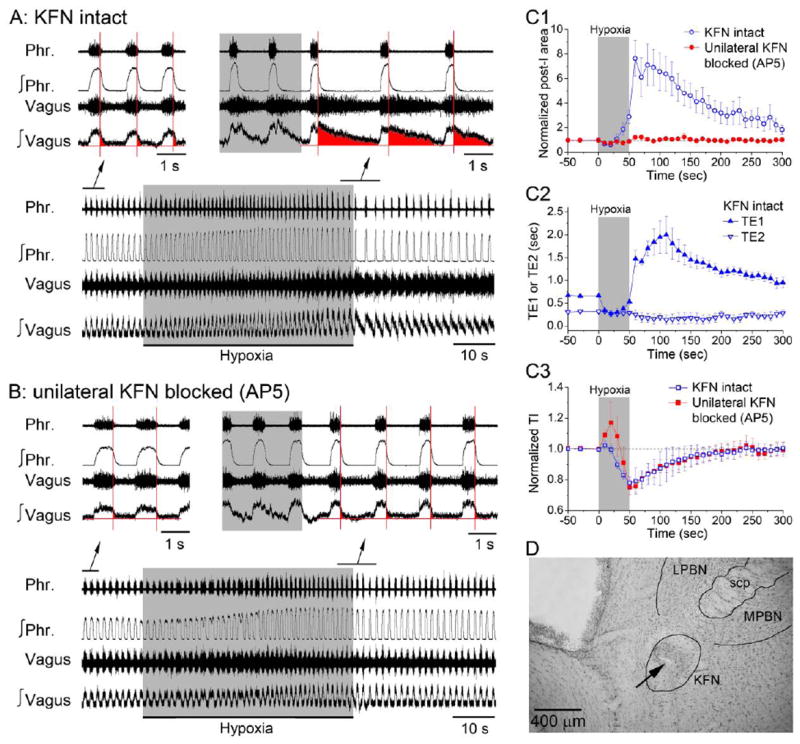
Figure 2. Temporal-cellular coincident fingerprinting of post-I pathway at systems level.

A:Timing-specific and response-specific markers of the post-I pathway as seen at the systems level from vagal-laryngeal post-I motor activity in rats. Post-I activity (red shaded area of integrated vagal-laryngeal motor activity in insets) was markedly increased after hypoxic stimulation indicating STP. Vertical red lines indicate onset of post-I phase as indicated by end of phrenic motor activity and onset of vagal-laryngeal post-I motor activity.
B: Cell-specific marker of the post-I pathway as seen at the systems level from the suppression of vagal-laryngeal post-I motor activity and abolition of its STP after microinjection of NMDAR antagonist AP5 into KFN.
C: Summary of all timing-specific, response-specific and cell-specific markers of the post-I pathway at the systems level (panel C1) as revealed by the post-hypoxic STP of vagal-laryngeal post-I motor activity (area of integrated vagal-laryngeal motor activity) and its abolition after microinjection of AP5 into KFN. Panels C2 and C3: Post-hypoxic STP and its abolition by NMDAR blockade was specific to the post-I phase (duration TE1) and not the late-expiratory phase (duration TE2) or inspiratory phase (duration TI). Data are means ± SE (n = 5).
D: Photo of microinjection site in intermediate KFN. Arrow indicates the lesion. LPBN, lateral parabrachial nucleus; MPBN, medial parabrachial nucleus; scp, superior cerebellum peduncle; 5, trigeminal motor nucleus.
