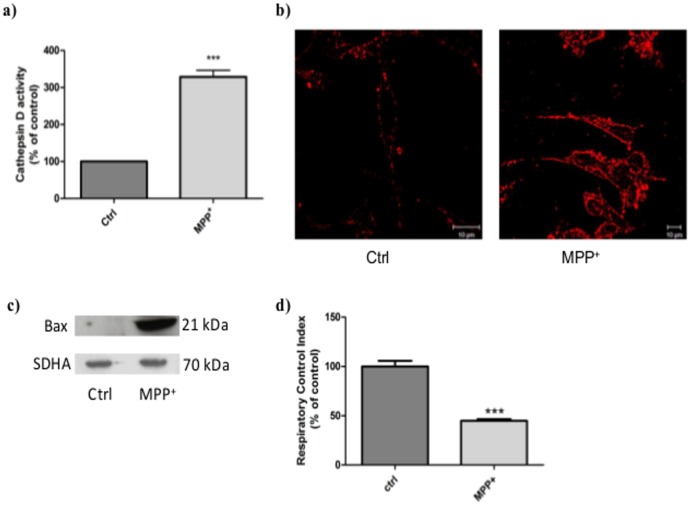
Figure 2. Characterization of MPP+-induced apoptosis.
Total, mitochondrial and cytosolic extracts were obtained from normal and MPP+-stressed SHSY5Y cells (0.5 mM, 6 h).a) CathD activity in cytosolic extracts. CathD activity was normalized by cell number in each sample and expressed as percentage of the activity in normal cells. Results are expressed in percentage of normal cell extract levels and presented as mean ± S.E.M. of four independent experiments in triplicate. *** p<0.01 compared to control cells. b) Immunofluorescence detection of total cathD in cells. Left: unstressed control cells (Ctrl), right: MPP+-stressed cells (6 h). Cells were observed with a confocal microscope Zeiss Axio Observer Z.1. Scale bar represents 10 μm. Negative control omitting the first antibody but in the presence of the second one (anti-goat Fluo 546) did not show any signal. c) Analysis by western blot of Bax relocation in mitochondrial membranes at 6 h, just after the end of stress. The amount of protein was normalized by the number of cells to avoid taking into account the increase of protein amount induced by the MPP+ stress. Succinate dehydrogenase-A (SDHA) was used as the loading control. This immunoblot is representative of three independent experiments in duplicate. d) Assessment of respiratory chain function 24 h after MPP+ treatment. The respiratory control index (RCI) i.e. ratio [state 3 rate] / [state 4 rate] was calculated. Results are expressed as percentage of unstressed control group and represent three independent experiments in triplicate. Results are presented as the mean ± S.E.M. *** p<0.01 compared to control cells.

