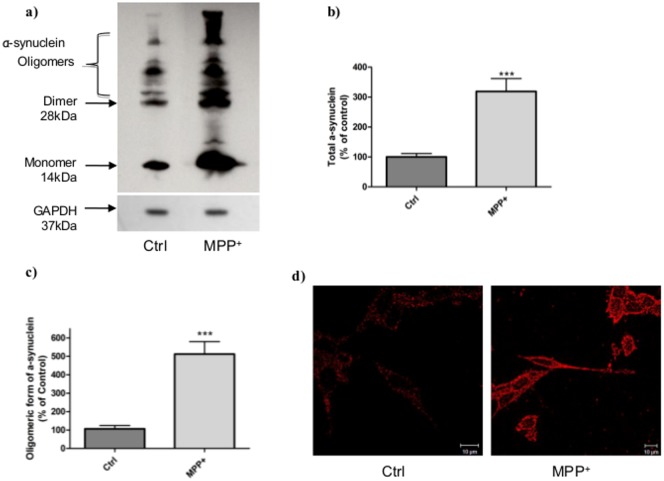
Figure 3. Characterization of α-synuclein aggregation in cells after MPP+ stress.
a) Typical immunoblot of α-synuclein in stressed (MPP+, 6h)) and unstressed (Ctrl) cells. b) Total and c) oligomeric forms of α-synuclein measured on stressed (MPP+) and unstressed (Ctrl) cells by Western Blot and quantified by ImageJ software. This immunoblot represents three independent experiments and is expressed as the mean ± S.E.M. *** p<0.01 compared to control cells. GAPDH was used as loading control. d) α-synuclein aggregation immunostaining with α-synuclein antibody in unstressed cells (Ctrl) and MPP+-stressed cells. Cells were observed with a confocal microscope Zeiss Axio Observer Z.1.

