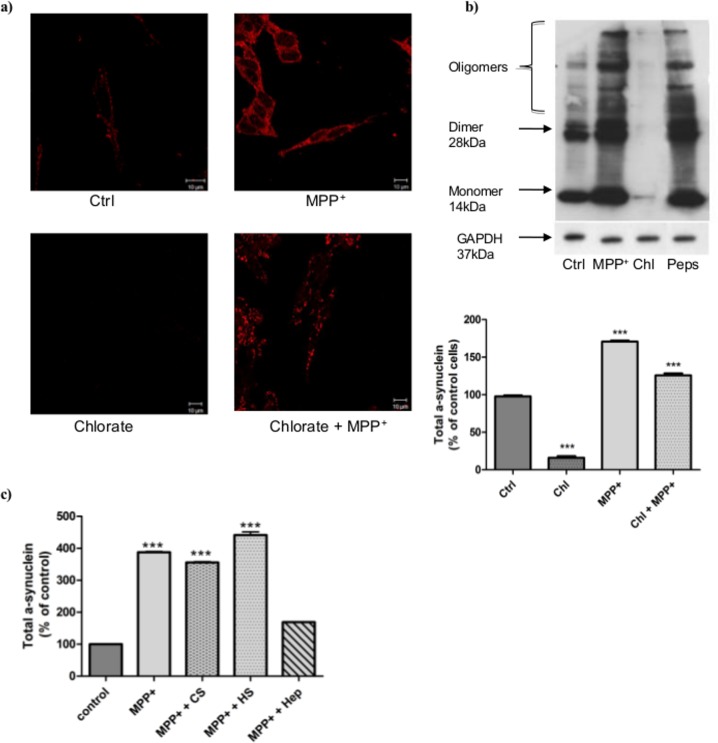
Figure 6. Effect of glycosaminoglycans sulfation on α-synuclein accumulation.
a) Total α-synuclein accumulation was detected after 6 h in normal (Ctrl) or MPP+-treated cells and after chlorate treatment (75 mM, 24h). α-synuclein aggregation was visualized by immunostaining. Cells were observed with a confocal microscope Zeiss Axio Observer Z.1. b) Western blot analysis of total α-synuclein in lysate of cells subjected or not to MPP+ stress (6 h) after treatment with sodium chlorate (75 mM, 24h) or the specific inhibitor of cathD, pepstatin A (Peps) (100 μM, 24h). Intensities of the bands obtained by western blot were quantified by ImageJ software and represent three independent experiments and are expressed as the mean ± S.E.M. *** p<0.001 compared to control cells. GAPDH was used as the loading control. c) Amounts of total α-synuclein in cells subjected or not to MPP+ stress (6 h) and followed by commercial GAGs treatment (Hep, HS and CS, 1 μg/mL). After 24 h, α-synuclein was detected by western blot and quantified with ImageJ software.

