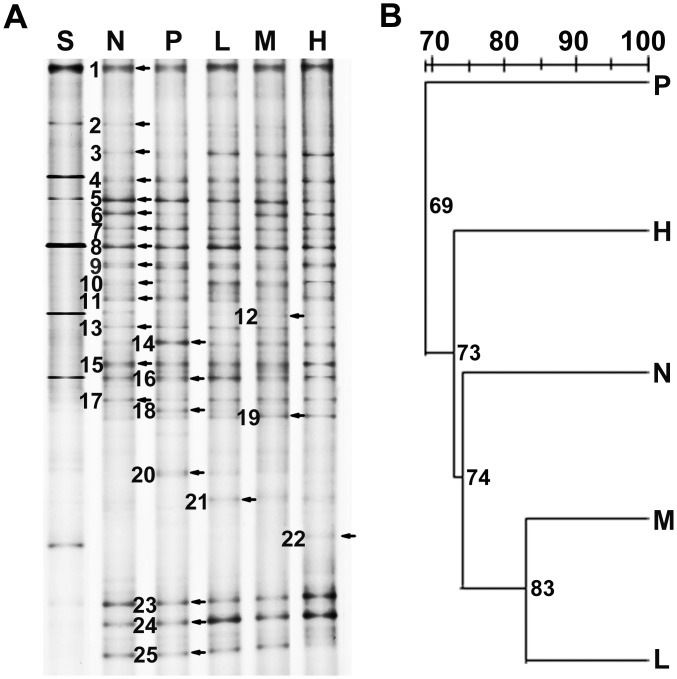
Figure 1. Bacterial community of weaned piglets fed with neomycin or E. faecalis.
(A) DGGE profiles of the V6~V8 regions of the 16S rDNA gene fragments from the samples. The denaturant gradient range is from 42% to 58%. The major difference bands are numbered. Lane S (Standard ladder, which are PCR products generated from different bacterial 16S rDNA genes with primers 968F-GC and 1401R); N (negative control, basal diet); P (positive control, diet supplemented with neomycin); L, M, H (diets supplemented with probiotics 0.5×10⁹, 1.0×10⁹ and 2.5×10⁹ CFU/kg feed, respectively); (B) UPGMA cluster analysis of Dice similarity indices from DGGE profiles.

