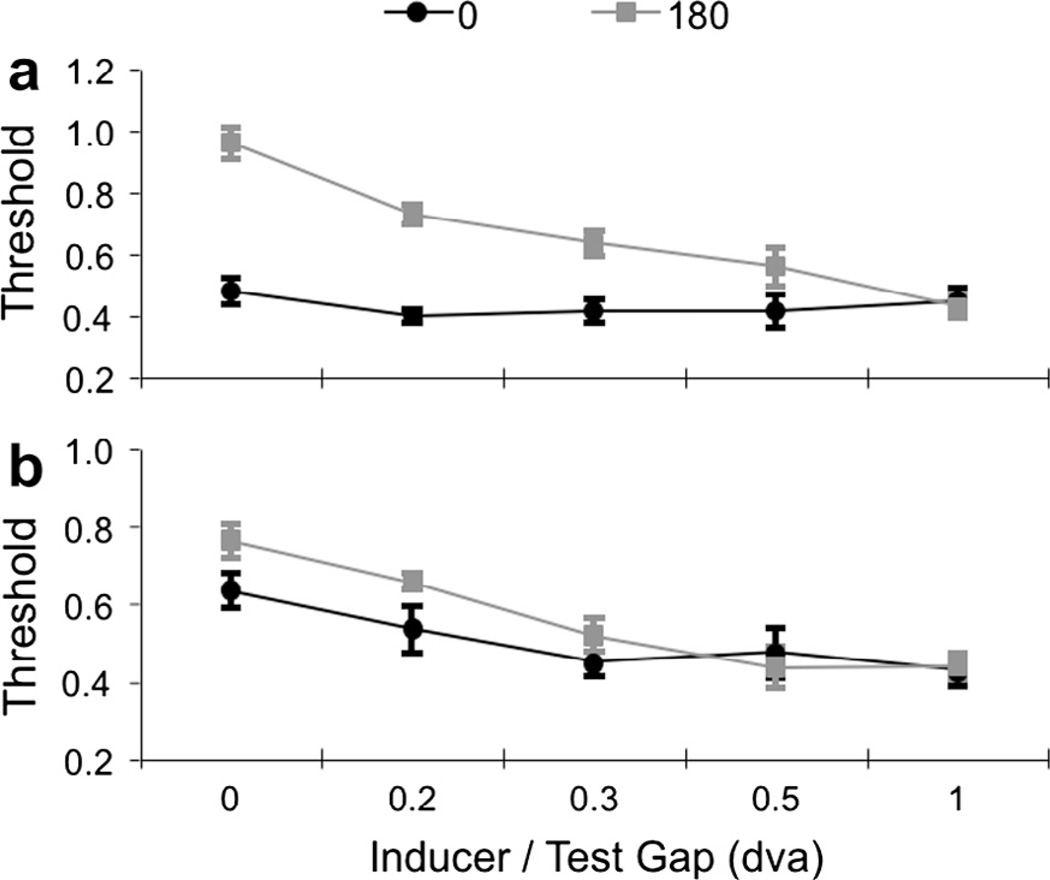
Fig. 4.
Results of Experiment 2. Target detection thresholds are plotted as a function of the spatial gap between target and inducing waveforms. Functions are plotted for targets abutting or proximate to leading (a) and trailing (b) edges of movement in inducing gratings. Data are plotted separately for thresholds obtained at a target/inducer phase relationship of 0° (in-phase, black) and 180° (out-of-phase, grey).

