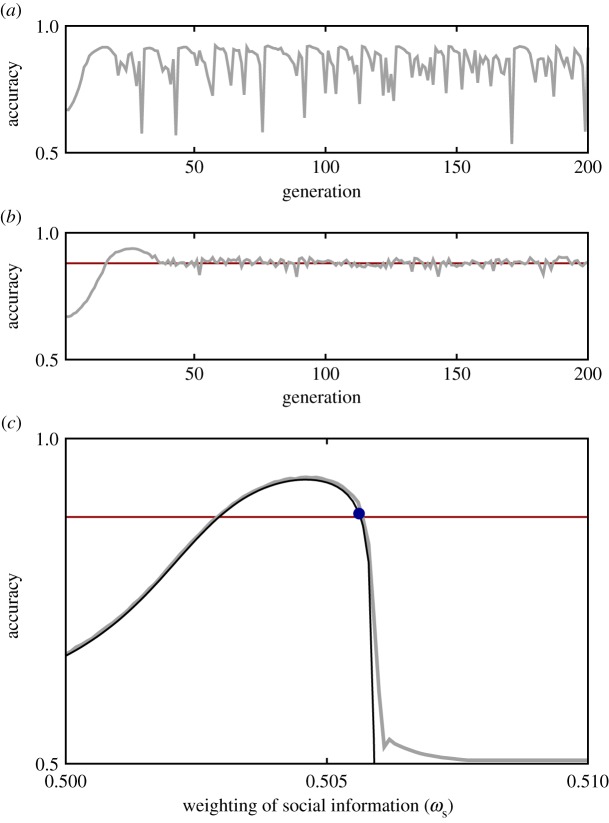
Figure 3.
Evolutionary analysis. (a) Average accuracy of an individual-based simulation of evolution. The square wave is employed with parameter values: k = 80, N = 500, ωg = 0.1, σ = 1 and TE = 200. A Gaussian mutation rate of 1 × 10⁻⁶ was used; this level of mutation leads to oscillations between high-accuracy generations and total unresponsiveness. (b) Average accuracy of an individual-based simulation with a mutation rate of 1 × 10⁻⁷. Evolution converges to a stable value (average over final 100 generations is shown in red). (c) Comparison of simulation and analytical solutions. The grey line shows accuracy for an individual-based simulation with a fixed weighting of social information (ωs). The red line indicates evolved accuracy from simulation. The black line shows the performance calculated from equation (4.2), and the blue point represents the analytical ESS calculated from equation (4.5).

