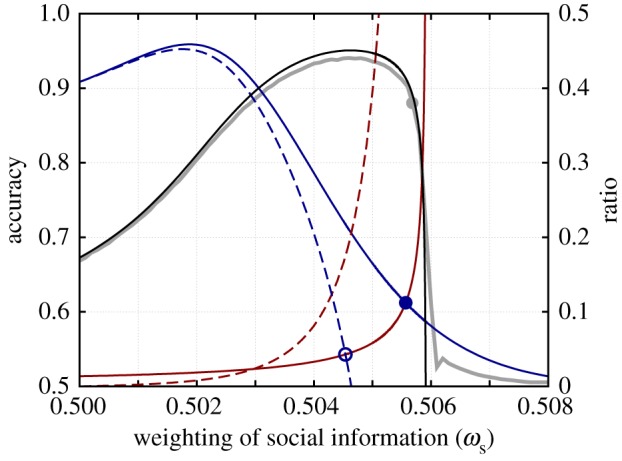
Figure 4.

Interpreting evolutionary stability and optimal performance. The grey line shows the accuracy as a function of ωs from the individual-based simulations (k = 80, N = 500, ωg = 0.1, σ = 1, TE = 200), the grey point shows the evolved average accuracy. The black line shows the accuracy calculated from the reduced model of equation (4.7). The solid red line shows the LHS of equation (4.10)  and the solid blue line shows the RHS of equation (4.10), where they intersect corresponds to the ESS value of the social weighting. The red dashed line shows the value of
  . Subtracting this from the solid blue line as in equation (4.12) and finding the intersection with
  (solid red line) gives the optimal weighting of social information.
