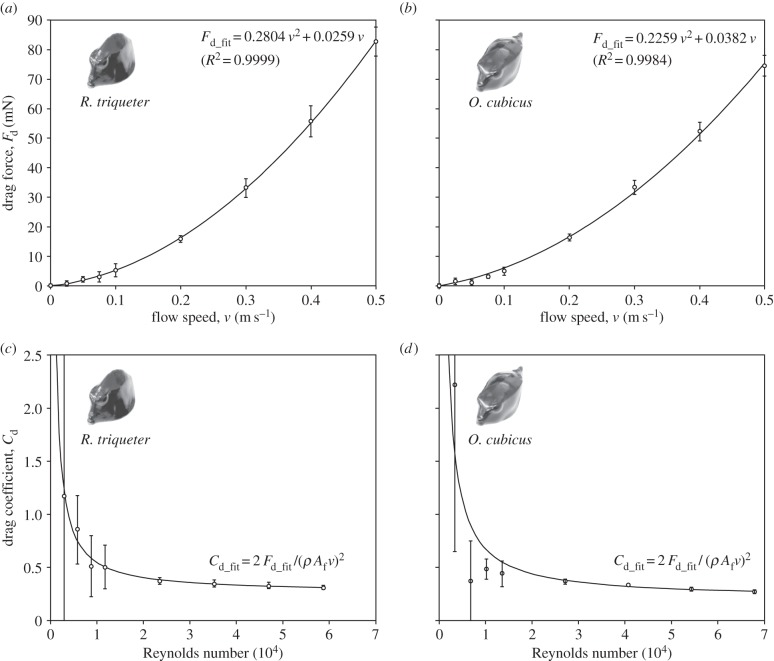
Figure 4.
Results for drag from the flow-tank experiments. (a,b) Drag forces and (c,d) drag coefficients are displayed. Second-order polynomial fits (Fd_fit) and the derived functions for drag coefficients (Cd_fit) illustrate the relationship with flow speed (a,b) or Reynolds number (c,d). Error bars denote the between-sampling standard deviation.

