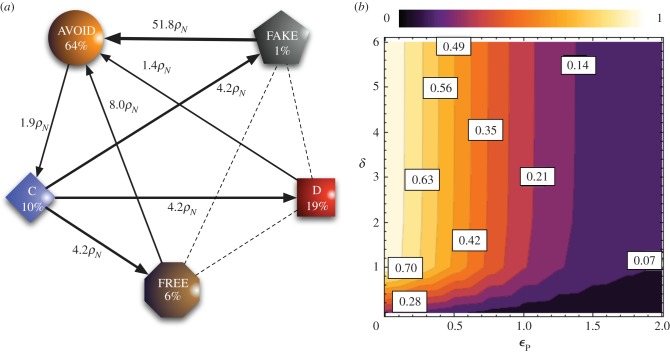
Figure 1.
(a) Stationary distribution and fixation probabilities. The population spends most of the time in the homogeneous state of AVOID. The black arrows identify the advantageous transitions, where ρN = 1/Z denotes the neutral fixation probability. The dashed lines denote neutral transitions. Note the cyclic pattern from cooperation to defection to commitment strategies and back. (b) Contour plot of the frequency of AVOID as a function of εP and δ. For a small enough cost of arranging the commitment, AVOID is abundant whenever a sufficient compensation is associated with the commitment deal. Parameters: N = 5, Z = 100, r = 3; β = 0.1; in panel (a), εP = 0.25, δ = 2.

